Emerson Stock Analysis
Last week was a slow week for the blog because work was really busy, so I figured I'd give y'all another stock analysis. This time I decided to take a look at Emerson Electric Company (EMR). Emerson closed on Friday 5/25/12 at $47.28.
Company Background:
Emerson Electric Co. operates as a diversified technology company worldwide. It engages in designing and supplying products and technology, and delivering engineering services and solutions to industrial, commercial, and consumer markets. The company’s Process Management segment offers customers products and technology, and engineering and project management services for precision measurement, control, monitoring, and asset optimization of oil and gas reservoirs and power generating plants, as well as for food and beverage, pulp and paper, pharmaceutical, and municipal water supply industries. Its Industrial Automation segment provides integrated manufacturing solutions for products, such as motors, power generating alternators, power transmission solutions, and fluid controls and materials joining equipment. The company’s Network Power segment designs, manufactures, installs, and maintains products, which offer grid to chip electric power conditioning, power reliability, and environmental control for telecommunications networks, data centers, and other critical applications, as well as provides comprehensive data center infrastructure management solutions. Its Climate Technologies segment offers products and services for the climate control industry, including residential heating and cooling, commercial air conditioning, and commercial and industrial refrigeration. The company’s Tools and Storage segment provides a range of professional and do-it-yourself tools, storage solutions, and appliances and components. Emerson Electric Co. operates primarily in the United States, Canada, Asia, Europe, Latin America, the Middle East, and Africa.
DCF Valuation:
Analysts expect Emerson to grow earnings 11.32% per year for the next five years and I've assumed they can continue to grow at 3.00% per year thereafter. Running these numbers through a DCF analysis with a 10% discount rate yields a fair value price of $70.40. This means that at $47.28 the shares are undervalued by 33%.
Graham Number:
Over the last 12 months, EMR's EPS were $3.16 and it's current book value per share is $14.33. The Graham Number is calculated to be $31.92 which means that at $47.28 the shares are overvalued by 48%.
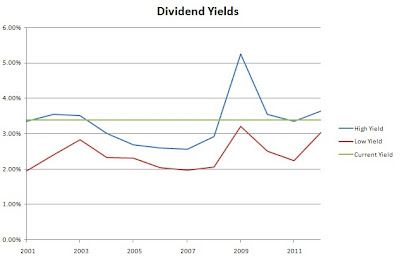
Average High Dividend Yield:
EMR's average high dividend yield for the past 5 years is 3.73% and for the past 10 years is 3.28%. This gives target prices of $42.84 and $48.83 respectively based on the current annual dividend of $2.80. These are overvalued by 10% and undervalued by 3%, respectively.
Average Low PE Ratio:
Emerson's average low PE ratio for the past 5 years is 12.70 and for the past 10 years is 14.78. This would correspond to a price per share of $43.05 and $50.11 respectively based off the analyst estimate of $3.39 per share for the fiscal year ending in September 2012. The 5 year and 10 year low PE price targets are overvalued by 10% and undervalued 5%, respectively.
Average Low P/S Ratio:
Emerson's average low PS ratio for the past 5 years is 1.22 and for the past 10 years is 1.32. This would correspond to a price per share of $41.34 and $44.66 respectively based off the analyst estimate for revenue growth from 2011 to 2012. The 5 year and 10 year low PE price targets are overvalued by 14% and 6%, respectively.
Dividend Discount Model:
For the DDM I assumed that Emerson will be able to grow dividends for the next 5 years at the minimum of 15% or the lowest of the 1, 3, 5 or 10 year growth rates. In this case that would be 6.62%. After that I assumed EMR can continue to raise dividends by 3.50% annually and used a discount rate of 7.5%. Based on this EMR is worth $40.33 meaning it's overvalued by 17%. While I think that Emerson can continue to increase it's dividend by more than 3% per year after 5 years it's a good estimate to use to give a conservative valuation price. I also feel that you will see a higher dividend growth rate for the next 10 years than a 6.62% rate.
PE Ratios:
EMR's trailing PE is 14.96 and it's forward PE is 12.06. The PE3 based on the average earnings for the last 3 years is 16.93. Compared to it's industry, EMR seems to be overvalued versus ABB (11.61) and undervalued versus GE (15.88). Against the industry as a whole (14.70), Emerson is fairly valued. All industry and competitor comparisons are on a TTM EPS basis.
Fundamentals:
Emerson's gross margin for FY 2009/10 and FY 2010/11 were 39.57% and 39.46% respectively. Their gross margin is very high at ~40% and consistent too. I like to see both a steady gross margin and around 40%. Their net income margin for the same years were 10.29% and 10.24% respectively. I like the net income margin to be at least 10% and preferably rising. Emerson is doing great on the net profit margin with a consistent 10%. The cash-to-debt ratio for the same years were 0.35 and 0.47. Emerson's cash-to-debt ratio is a little low for my liking but it is improving. If they can continue to make progress on getting it closer to 1.00 that would be icing on the cake.
Share Buyback:
EMR has bought back an average of 1.40% of their shares outstanding annually since 2003.

A negative number for the % change value means shares were bought back by the company and a positive value means the shares outstanding increased.
Dividend Analysis:
Emerson is a dividend champion with 55 consectutive years of dividend increases. Their average increase has been for the last 1, 3, 5 and 10 years 15.94%, 6.62%, 8.79% and 7.45%. While they have been increasing their dividend at a significant rate the best part is that their payout ratio has been falling from 64% in 2001 to 42% in 2011. This is good news for dividend growth investors since it is allowing more room for further expansion of the dividend and leaves a cushion should earnings take a hit due to another economic downturn.


Return on Equity and Return on Capital Invested:
Emerson's ROE and ROCI have been increasing growth since 2001. I prefer to see a general uptrend in both the ROE and ROCI. Their ROE has risen from 16.90% in 2001 to 24.10% in 2011 while their ROCI has increased from 12.3% in 2001 to 17.0% in 2011.

Revenue and Net Income:
Since the basis of dividend growth is revenue and net income growth I've added a new section to my stock analysis. Here you can see Emerson's history of revenue and net income since 2001. Their revenue growth is cyclical in nature but ends up higher then the previous high once the economy rights itself.

Average Price and EPS:

Emerson's average share price has tracked their EPS growth fairly well since 2001. It appears that the price is lagging the EPS trend since FY 2010/11 ended. This could be a good sign for capital appreciation as well as a solid dividend yield.
Forecast:

The chart shows the historical prices for the previous 10 years and the forecast based on the average PE ratios and the expected EPS values. I have also included a forecast based off a PE ratio that is only 75% of the average low PE ratio for the previous 5 years, 10 years or 16 whichever is least. I like to the look to buy at the 75% Low PE price or lower to provide for additional margin of safety. In this case the target PE is 9.5 which in my opinion is too low for Emerson to sell for. Currently Emerson is trading at a $14.99 premium to the forecast entry price. The entry price based on the average PE10 is $58.95 which means it's selling at a $11.67 discount.
Conclusion:
The average of all the valuation models gives a fair value of $53.28 which means that Emerson is currently trading at a 11% discount to the fair value.
At the current levels I think you can get good value but there is definitely more to be had. With a current yield of 3.38% I would initiate a position but would be scaling in further on future pullbacks. A 3.50% yield would correspond to a $45.71 price. That would be a further pullback of 3.3%. With Europe rearing it's ugly head again this summer, volatility is sure to spike and the 3.50% target might come up, and who knows we just might breach the 4.00% yield as well.
Company Background:
Emerson Electric Co. operates as a diversified technology company worldwide. It engages in designing and supplying products and technology, and delivering engineering services and solutions to industrial, commercial, and consumer markets. The company’s Process Management segment offers customers products and technology, and engineering and project management services for precision measurement, control, monitoring, and asset optimization of oil and gas reservoirs and power generating plants, as well as for food and beverage, pulp and paper, pharmaceutical, and municipal water supply industries. Its Industrial Automation segment provides integrated manufacturing solutions for products, such as motors, power generating alternators, power transmission solutions, and fluid controls and materials joining equipment. The company’s Network Power segment designs, manufactures, installs, and maintains products, which offer grid to chip electric power conditioning, power reliability, and environmental control for telecommunications networks, data centers, and other critical applications, as well as provides comprehensive data center infrastructure management solutions. Its Climate Technologies segment offers products and services for the climate control industry, including residential heating and cooling, commercial air conditioning, and commercial and industrial refrigeration. The company’s Tools and Storage segment provides a range of professional and do-it-yourself tools, storage solutions, and appliances and components. Emerson Electric Co. operates primarily in the United States, Canada, Asia, Europe, Latin America, the Middle East, and Africa.
DCF Valuation:
Analysts expect Emerson to grow earnings 11.32% per year for the next five years and I've assumed they can continue to grow at 3.00% per year thereafter. Running these numbers through a DCF analysis with a 10% discount rate yields a fair value price of $70.40. This means that at $47.28 the shares are undervalued by 33%.
Graham Number:
Over the last 12 months, EMR's EPS were $3.16 and it's current book value per share is $14.33. The Graham Number is calculated to be $31.92 which means that at $47.28 the shares are overvalued by 48%.
Average High Dividend Yield:
EMR's average high dividend yield for the past 5 years is 3.73% and for the past 10 years is 3.28%. This gives target prices of $42.84 and $48.83 respectively based on the current annual dividend of $2.80. These are overvalued by 10% and undervalued by 3%, respectively.

Average Low PE Ratio:
Emerson's average low PE ratio for the past 5 years is 12.70 and for the past 10 years is 14.78. This would correspond to a price per share of $43.05 and $50.11 respectively based off the analyst estimate of $3.39 per share for the fiscal year ending in September 2012. The 5 year and 10 year low PE price targets are overvalued by 10% and undervalued 5%, respectively.
Average Low P/S Ratio:
Emerson's average low PS ratio for the past 5 years is 1.22 and for the past 10 years is 1.32. This would correspond to a price per share of $41.34 and $44.66 respectively based off the analyst estimate for revenue growth from 2011 to 2012. The 5 year and 10 year low PE price targets are overvalued by 14% and 6%, respectively.
Dividend Discount Model:
For the DDM I assumed that Emerson will be able to grow dividends for the next 5 years at the minimum of 15% or the lowest of the 1, 3, 5 or 10 year growth rates. In this case that would be 6.62%. After that I assumed EMR can continue to raise dividends by 3.50% annually and used a discount rate of 7.5%. Based on this EMR is worth $40.33 meaning it's overvalued by 17%. While I think that Emerson can continue to increase it's dividend by more than 3% per year after 5 years it's a good estimate to use to give a conservative valuation price. I also feel that you will see a higher dividend growth rate for the next 10 years than a 6.62% rate.
PE Ratios:
EMR's trailing PE is 14.96 and it's forward PE is 12.06. The PE3 based on the average earnings for the last 3 years is 16.93. Compared to it's industry, EMR seems to be overvalued versus ABB (11.61) and undervalued versus GE (15.88). Against the industry as a whole (14.70), Emerson is fairly valued. All industry and competitor comparisons are on a TTM EPS basis.
Fundamentals:
Emerson's gross margin for FY 2009/10 and FY 2010/11 were 39.57% and 39.46% respectively. Their gross margin is very high at ~40% and consistent too. I like to see both a steady gross margin and around 40%. Their net income margin for the same years were 10.29% and 10.24% respectively. I like the net income margin to be at least 10% and preferably rising. Emerson is doing great on the net profit margin with a consistent 10%. The cash-to-debt ratio for the same years were 0.35 and 0.47. Emerson's cash-to-debt ratio is a little low for my liking but it is improving. If they can continue to make progress on getting it closer to 1.00 that would be icing on the cake.
Share Buyback:
EMR has bought back an average of 1.40% of their shares outstanding annually since 2003.

A negative number for the % change value means shares were bought back by the company and a positive value means the shares outstanding increased.
Dividend Analysis:
Emerson is a dividend champion with 55 consectutive years of dividend increases. Their average increase has been for the last 1, 3, 5 and 10 years 15.94%, 6.62%, 8.79% and 7.45%. While they have been increasing their dividend at a significant rate the best part is that their payout ratio has been falling from 64% in 2001 to 42% in 2011. This is good news for dividend growth investors since it is allowing more room for further expansion of the dividend and leaves a cushion should earnings take a hit due to another economic downturn.


Return on Equity and Return on Capital Invested:
Emerson's ROE and ROCI have been increasing growth since 2001. I prefer to see a general uptrend in both the ROE and ROCI. Their ROE has risen from 16.90% in 2001 to 24.10% in 2011 while their ROCI has increased from 12.3% in 2001 to 17.0% in 2011.

Revenue and Net Income:
Since the basis of dividend growth is revenue and net income growth I've added a new section to my stock analysis. Here you can see Emerson's history of revenue and net income since 2001. Their revenue growth is cyclical in nature but ends up higher then the previous high once the economy rights itself.

Average Price and EPS:

Emerson's average share price has tracked their EPS growth fairly well since 2001. It appears that the price is lagging the EPS trend since FY 2010/11 ended. This could be a good sign for capital appreciation as well as a solid dividend yield.
Forecast:

The chart shows the historical prices for the previous 10 years and the forecast based on the average PE ratios and the expected EPS values. I have also included a forecast based off a PE ratio that is only 75% of the average low PE ratio for the previous 5 years, 10 years or 16 whichever is least. I like to the look to buy at the 75% Low PE price or lower to provide for additional margin of safety. In this case the target PE is 9.5 which in my opinion is too low for Emerson to sell for. Currently Emerson is trading at a $14.99 premium to the forecast entry price. The entry price based on the average PE10 is $58.95 which means it's selling at a $11.67 discount.
Conclusion:
The average of all the valuation models gives a fair value of $53.28 which means that Emerson is currently trading at a 11% discount to the fair value.
At the current levels I think you can get good value but there is definitely more to be had. With a current yield of 3.38% I would initiate a position but would be scaling in further on future pullbacks. A 3.50% yield would correspond to a $45.71 price. That would be a further pullback of 3.3%. With Europe rearing it's ugly head again this summer, volatility is sure to spike and the 3.50% target might come up, and who knows we just might breach the 4.00% yield as well.
Comments
Post a Comment